About Speed-Time Graph
A Speed-Time Graph plots the speed of an object against its time.
In this revision note, you will learn how to find distance in Speed-Time Graph.
You will also learn other applications like:
- Finding Acceleration
- Find Average Speed
- Important Definitions
- Relationships between Speed-Time, Distance-Time, and Acceleration-Time Graphs
Before you read on, you might want to download this entire revision notes in PDF format to print it out, or to read it later.
This will be delivered to your email inbox.

How to Find Distance in Speed-Time Graph
The diagram below shows a speed-time graph of a car. A straight line indicates a constant speed for a length of time. In order to calculate distance traveled, you’ll need to consider the horizontal axis and vertical axis as length and breadth. By treating this shape as an area, you can easily calculate distance traveled.
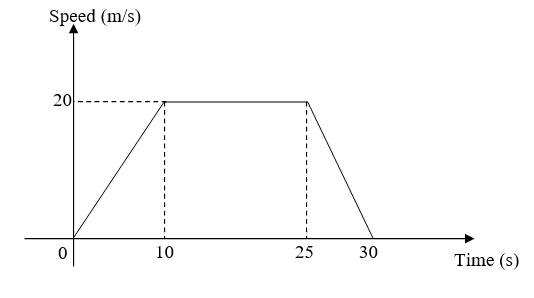
For Example:
Distance travelled, from 0 s to 10 s
= 1/2 x 10 x 20
= 100 m
Distance travelled, from 10 s to 25 s
= 15 x 20
= 300 m
Distance travelled, from 25 s to 30 s
= 1/2 x 5 x 20
= 50 m
Total Distance = 100 + 300 + 50
= 450 m
Example of Finding Average Speed in Speed-Time Graph
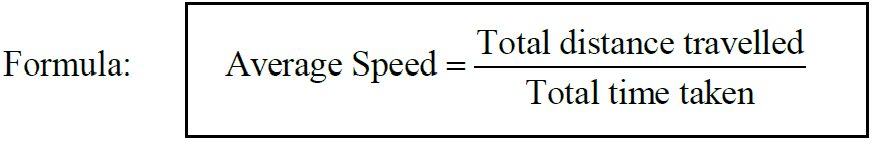
In order to determine the average speed over a length of period, you’ll need the total distance covered and the total time taken.
Average Speed = Total distance travelled ÷ Total time taken
= 450 m ÷ 30 s
= 15 m/s
How to Find Acceleration in Speed-Time Graph
The gradient of the speed-time graph gives the acceleration.
Example of Finding Acceleration in Speed‒Time Graph
For first 10 s, Acceleration,
a = 20 m/s ÷ 10 s
= 2 m/s2 (acceleration)
For last 5s,
a = (0 – 20 m/s) ÷ 5 s
= –4 m/s2 (retardation or deceleration)
Important Definitions of Kinematics
Initial = at the beginning t = 0
Instantaneously at rest v = 0
Stationary v = 0
Constant velocity a = 0
1. Velocity is the rate of change of displacement or distance in a particular direction with respect to time. (Can be Negative → Going in Negative Direction)

2. Speed is the rate of change of distance. (Cannot be Negative)

3. Average speed
4. Acceleration is the rate of change of velocity with respect to time.

About Distance-time Graphs
The diagram shows a distance-time graph of a car travelling from City A to City B.
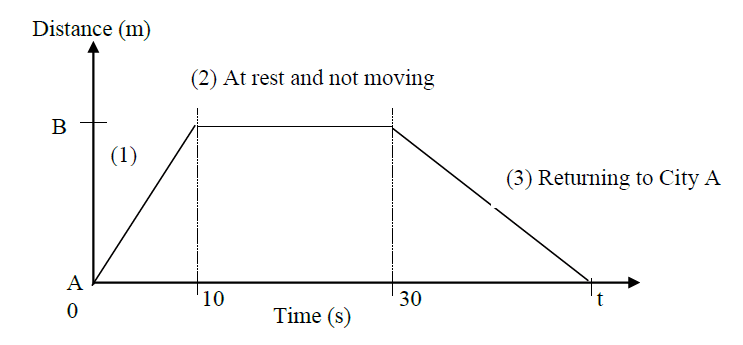
(1) Positive (+) gradient indicates car travelling away from City A to City B.
(2) Zero gradient indicate car is at rest and not moving.
(3) Negative (‒) gradient indicates car is returning towards City A.
At any given time, calculating speed is done by finding the gradient of the graph.
Example of Distance-Time Graph
Find speed and average speed from distance‒time graph

From time, t = 2 h to 3 h,
Speed = 20 km ÷ 1 h
= 20 km/h
![]()
(Note: total time taken includes rest time)
For the whole journey,
![]()
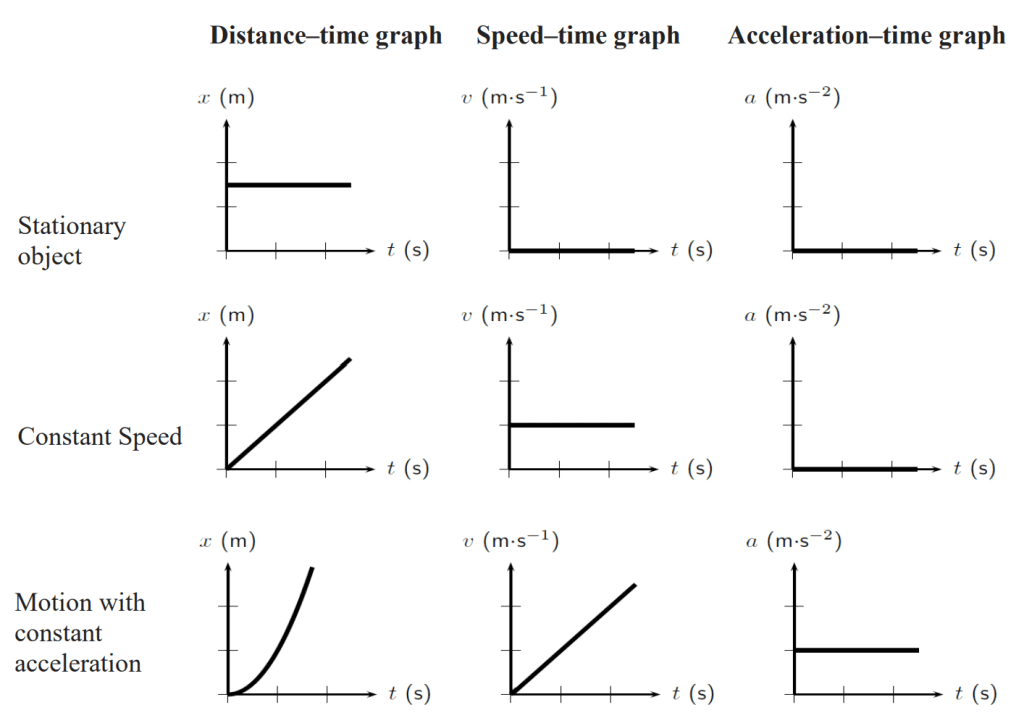
Relationship of Distance-Time Graph, Speed-Time Graph, and Acceleration-Time Graph
Here are some different graphs that all show an object moving. Depending on the distance moved across the entire journey, and the type of graph, calculating distance is done through different methods.
Sketching of distance-time and acceleration–time graphs from speed-time graph
Given the following speed-time graph, sketch the corresponding distance-time and
acceleration–time graph.

The area under a speed‒time graph gives the distance travelled
At t = 20 s, d1 = 1/2 × 20 × 30 = 300 m
At t = 45 s, d2 = 300 + 23 × 30 = 1050 m
At t = 50 s , d3 = 1050 + 1/2 × 5 × 30 = 1125 m
Using the information above, we can now sketch the distance-time graph.

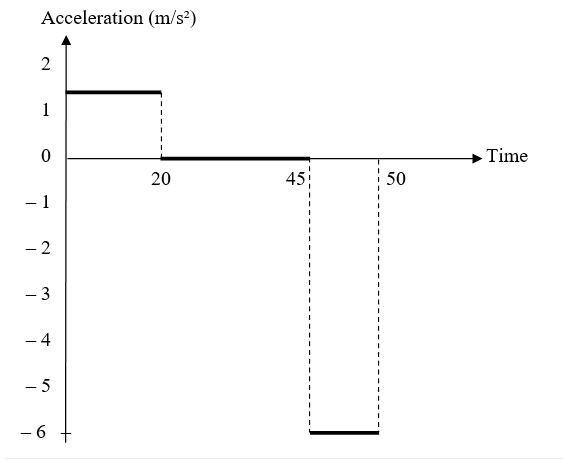
The gradient of a speed-time graph gives acceleration.
At t = 0 to 20 s, a1 = (30 – 0) / (20 – 0) = 1.5 m/s 2
At t = 20 to 45 s, a2 = (30 – 30) / (45 – 25) = 0 m/s 2
At t = 45 to 50 s , a3 = (0 – 30) / (50 – 45) = – 6 m/s2
Last Minute Revision for O Level Math?
Check out our exam guide on other topics here!
Before you go, you might want to download this entire revision notes in PDF format to print it out, or to read it later.
This will be delivered to your email inbox.
Does your child need help with Mathematics? Find out more about our Math Tuition Class Free Trial.
1) Live Zoom Lessons at Grade Solution Learning Centre

At Grade Solution Learning Centre, we are a team of dedicated educators whose mission is to guide your child to academic success. Here are the services we provide:
– Live Zoom lessons
– Adaptably™, a smart learning platform that tracks your child’s progress, strengths and weaknesses through personalised digital worksheets.
– 24/7 Homework Helper Service
We provide all these services above at a very affordable monthly fee to allow as many students as possible to access such learning opportunities. We also offer a free trial class and consultation with our tutors, to help make sure we are the best fit for your child.
We specialise in English, Math, and Science subjects.
You can see our fees and schedules here >>
2) Pre-recorded Online courses on Jimmymaths.com

If you are looking for something that fits your budget, or prefer your child learn at his or her own pace, you can join our pre-recorded online Math courses.
Your child can:
– Learn from recorded videos
– Get access to lots of common exam questions to ensure sufficient practice
– Get unlimited support and homework help
You can see the available courses here >>