In these revision notes, you will learn the following:
Trigonometric Graphs of Sine, Cosine, and Tangent Functions
Amplitude, Period and other properties of Trigonometric Graphs
Step-by-step walkthrough on how to sketch Trigonometric Graphs
Before you read on, you might want to download this entire revision notes in PDF format to print it out, or to read it later. This will be delivered to your email inbox.
Trigonometric Graphs of Sine, Cosine and Tangent Functions
Understanding Trigonometric Functions
Trigonometric functions are fundamental mathematical relationships that connect the angles and side lengths of triangles. The three primary trig functions are sine, cosine, and tangent. Each of these functions offers a unique perspective on the relationships within a triangle, making them indispensable tools for solving trigonometric equations and understanding the behaviour of periodic functions.
Understanding Trigonometric Graphs
Trigonometric graphs are visual representations of trigonometric functions, showcasing how these functions behave over a range of angles. The sine, cosine, and tangent functions each produce distinct graphs that illustrate their unique properties. For instance, the sine and cosine graphs are smooth and wave-like, while the tangent graph features asymptotes where the function is undefined.
Illustration of Trigonometric Graphs
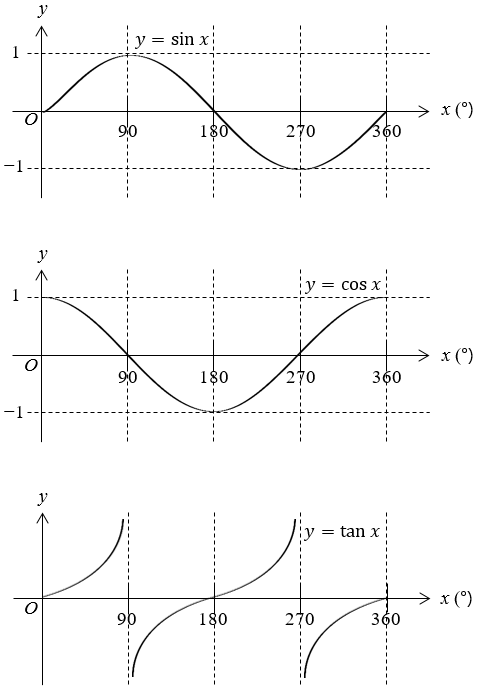
The figures below show the basic graphs of the sine function (y = sin x), cosine function (y = cos x), and tangent function (y = tan x).
Each of the graphs illustrates one complete cycle (or wave). The cosine graph is essentially a sine graph shifted by 90 degrees, and both graphs exhibit periodicity, with maximum and minimum values at specific points.
In other words, the basic graphs of y = −sin x, y = −cos x, and y = −tan x can be obtained by flipping the original curves about the x-axis, as shown in the figures below.
*Note the tangent graph will not intersect the vertical lines x = 90°, x = 270°, etc. These lines are called asymptotes of the graph.
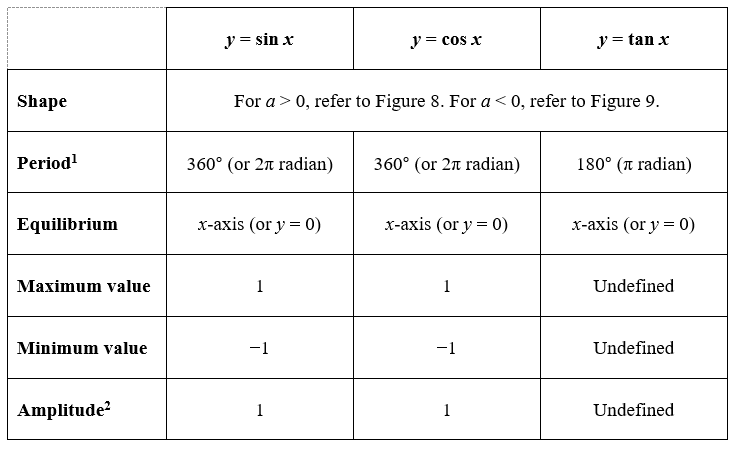
The following table summarises the key characteristics of the basic trigonometric graphs.
1Period of the trigonometric graph refers to the interval for 1 complete cycle or wave. 2The amplitude is the distance between the maximum value and the equilibrium.
How to Draw Trigonometric Graphs
Key Features of Trigonometric Functions Graphs
Graphs of trigonometric functions possess several key features that define their shape and behaviour. The domain of a trigonometric function includes all possible input values (x-values) for which the function is defined, while the range encompasses all possible output values (y-values).
Step-by-Step Process
To sketch the graphs of y= a sin bx + c, y = a cos bx + c, and y =a tan bx accurately, we need to determine the following key characteristics.
(1) Basic shape of trigo function.
(2) Period: The interval for which the curve repeats itself. When b increase, there will be more cycles in the same interval.
(3) Equilibrium: The centre line that passes through the middle of the graph.
(4) Maximum and minimum values. This allows us to determine the amplitude of the graph (distance between the maximum value and equilibrium).
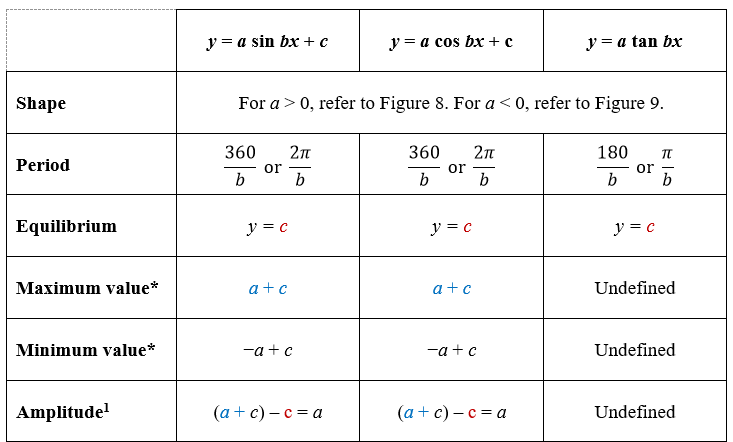
The following table summarises how the constants a, b and c affect the key characteristics of the trigonometric graphs.
*The maximum and minimum values will switch when a < 0. 1The amplitude is the distance between the maximum value and the equilibrium.
In general,
– a determines the latitudinal ↑ stretch (or compression) of the graph,
– b determines the longitudinal ↔ stretch (or compression) of the graph, and
– c shifts the entire graph upwards (or downwards) by c units.
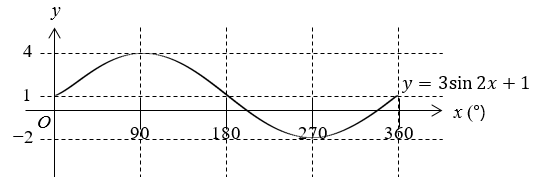
Example 1
Sketch the graph of y = 3 sin 2x + 1, for 0° ≤ x ≤ 360°.
Solution:
Period = 360/2=180° (There is a complete cycle for every 180° interval)
Maximum value = 3 + 1 = 4
Equilibrium is y = 1
Minimum value = −3 + 1 = −2
Example 2
Sketch the graph of y = −2 cos πt/2 + 3, for 0 ≤ t ≤ 2.
Solution:
Period = 2π/(π/2)=4 (There is a complete cycle for every 4−unit interval. Since the range for t is up to 2, we only draw half a cycle.)
Maximum value = 2 + 3 = 5
Equilibrium is y = 3
Minimum value = −2 + 3 = 1
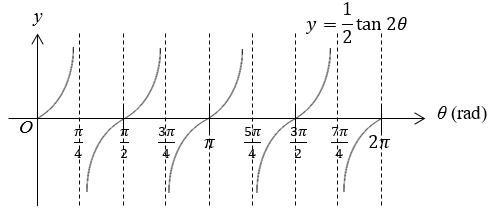
Example 3
Sketch the graph of y = 1/2 tan2θ, for 0 ≤ θ ≤ 2π.
Solution:
Period = 2π/2 = π (There is a complete cycle for every π radian interval. Since the range for θ is up to 2π, we have to draw 2 cycles.)
Before you go, you might want to download this entire revision notes in PDF format to print it out, or to read it later.
This will be delivered to your email inbox.
Does your child need help with Mathematics?
Find out more about our Math Tuition Class Free Trial.
1) Live Zoom Lessons at Grade Solution Learning Centre
At Grade Solution Learning Centre, we are a team of dedicated educators whose mission is to guide your child to academic success. Here are the services we provide:
– Live Zoom lessons
– Adaptably, a smart learning platform that tracks your child’s progress, strengths and weaknesses through personalised digital questions.
– 24/7 Homework Helper Service
We provide all these services above at a very affordable monthly fee to allow as many students as possible to access such learning opportunities. We also offer a free trial class and consultation with our tutors, to help make sure we are the best fit for your child.
We specialise in English, Math, Science, and Chinese subjects.
If you are looking for something that fits your budget, or prefer your child learn at his or her own pace, you can join our pre-recorded online Math courses.
Your child can:
– Learn from recorded videos
– Get access to lots of common exam questions to ensure sufficient practice