What is a Stem and Leaf Diagram?
Stem and leaf diagrams help to organise large amounts of numerical data by splitting each value into two parts:
- The leaf contains only the last digit of each value.
- The stem consists of the remaining digit(s) to the left.
This visualization tool preserves individual data points while showing their distribution. To create an effective stem and leaf diagram:
- Leaf values must be arranged in ascending order (smallest value to largest value).
- Stem values must be listed numerically.
- Include a key that explains how to interpret the diagram (e.g., “2|5 represents 25”)
- Check that the number of leaves matches the total number of data collected.
Stem and leaf plots can be used with whole numbers and decimal values. Always include appropriate units in your key when necessary.
Stem and Leaf Plot Examples
Example 1
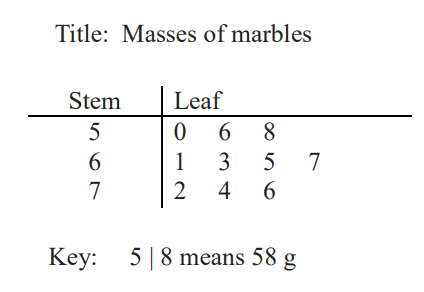
The masses of 10 marbles are given as shown:
56 g, 63 g, 74 g, 50 g, 61 g, 72 g, 58 g, 65 g, 76 g, 67 g.
Represent the data using a stem-and-leaf diagram.
Solution:
Step 1: The stem will be the digits in the tens place. The stem is arranged in numerical order.
Step 2: Work from left to right in the data set. The leaves are placed in the corresponding rows.
Step 3: The leaves are put in ascending order (smallest to largest).
Step 4: Create a key and the title
Example 2
The stem-and-leaf diagram shows the number of candies in a gift box.
Number of candies
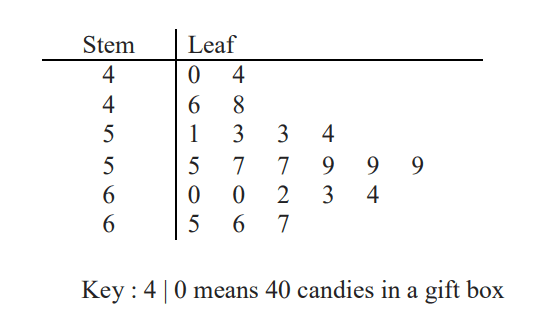
(i) What is the most common number of candies?
(ii) Find the percentage of gift boxes with more than 55 candies.
Solution:
(i) The most common number of candies is 59. (ans)
(ii) Total number of gift boxes = 22
Number of gift boxes with more than 55 candies = 13 (ans)
Percentage = 13/22 × 100% = 59.1% (to 3 s.f.) (ans)
Back-to-back Stem-and-Leaf Diagram
When two sets of data are given, we can use a stem-and-leaf diagram with a common stem to represent the data. This is known as a back-to-back Stem-and-leaf diagram
Example 1
The results of a Mathematics Quiz for two Secondary 2 classes are given as shown.
Class 2A 70 45 63 68 98 85 70 50 66 47
Class 2B 55 79 92 78 42 80 82 88 90 94
(i) Construct a back-to-back stem-and-leaf diagram
(ii) Calculate the percentage of students who scored 80 and above in each class
(iii) Which class performed better in the quiz ? Use the back-to-back stem-and-leaf diagram in (i) to explain your answer.
Solution:
(i)

(ii) Class 2A students scored 80 and above = 2, percentage =2/10 × 100% = 20% (ans)
Class 2B students scored 80 and above = 6, percentage = 6/10 × 100% = 60%(ans)
(iii) Class 2B performed better than class 2A as there are more students in class 2B scored 80 and above than class 2A.
Pros and Cons of Different Statistical Plots
The choice of statistical representation depends on the data set and the purpose of collection. Let’s explore the key advantages and disadvantages of each statistical plot type.
Dot diagram
- Advantages: Provides a straightforward way to display small data sets with distinct values, making it easy to visualise the shape and spread of the data.
- Disadvantages: Becomes visually cluttered with larger data sets, making it difficult to identify patterns.
Histogram
- Advantage: Clearly displays the frequency distribution, making it easy to identify the highest and lowest frequencies.
- Disadvantages: Individual data values are lost in the grouping process. The choice of bin width can significantly affect interpretation and potentially misrepresent the data.
Stem-and-leaf diagram
- Advantages: Preserves individual data values while showing distribution shape. Allows the median value (middle value) and outliers to be identified quickly.
- Disadvantages: Not useful for larger data sets with extreme values, as it can get difficult to manage the number of stems and leaves.